Running reports
Overview
Expand the Reporting menu item to display the available reports. Click on a report name to navigate to, and run that report.
Report filters
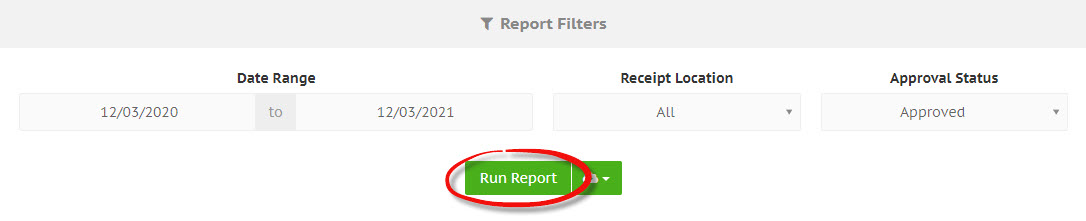
Above each report table is a Report Filters panel. Select the filter values within this panel and click Run Report to generate the new report.
Export report
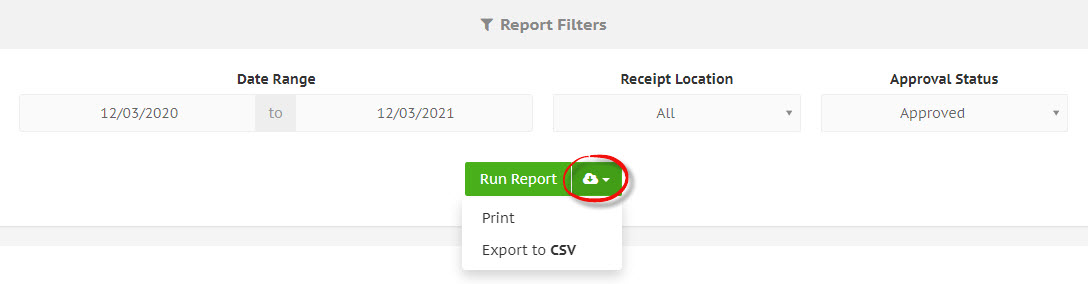
In the Report Filters panel, click the green cloud download icon on the right-hand side of the Run Report button. This will display a dropdown list with options for exporting the report data.
Drilldown
If available on the report, on the right-hand side of the selected report row, click the cog icon to view a number of options for that particular report item, included drilldown options.
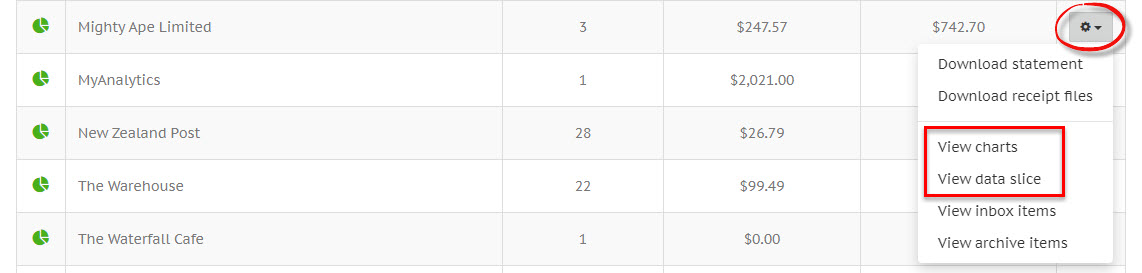
Charts
Click on the View charts option to see a breakdown of that report item in chart format.
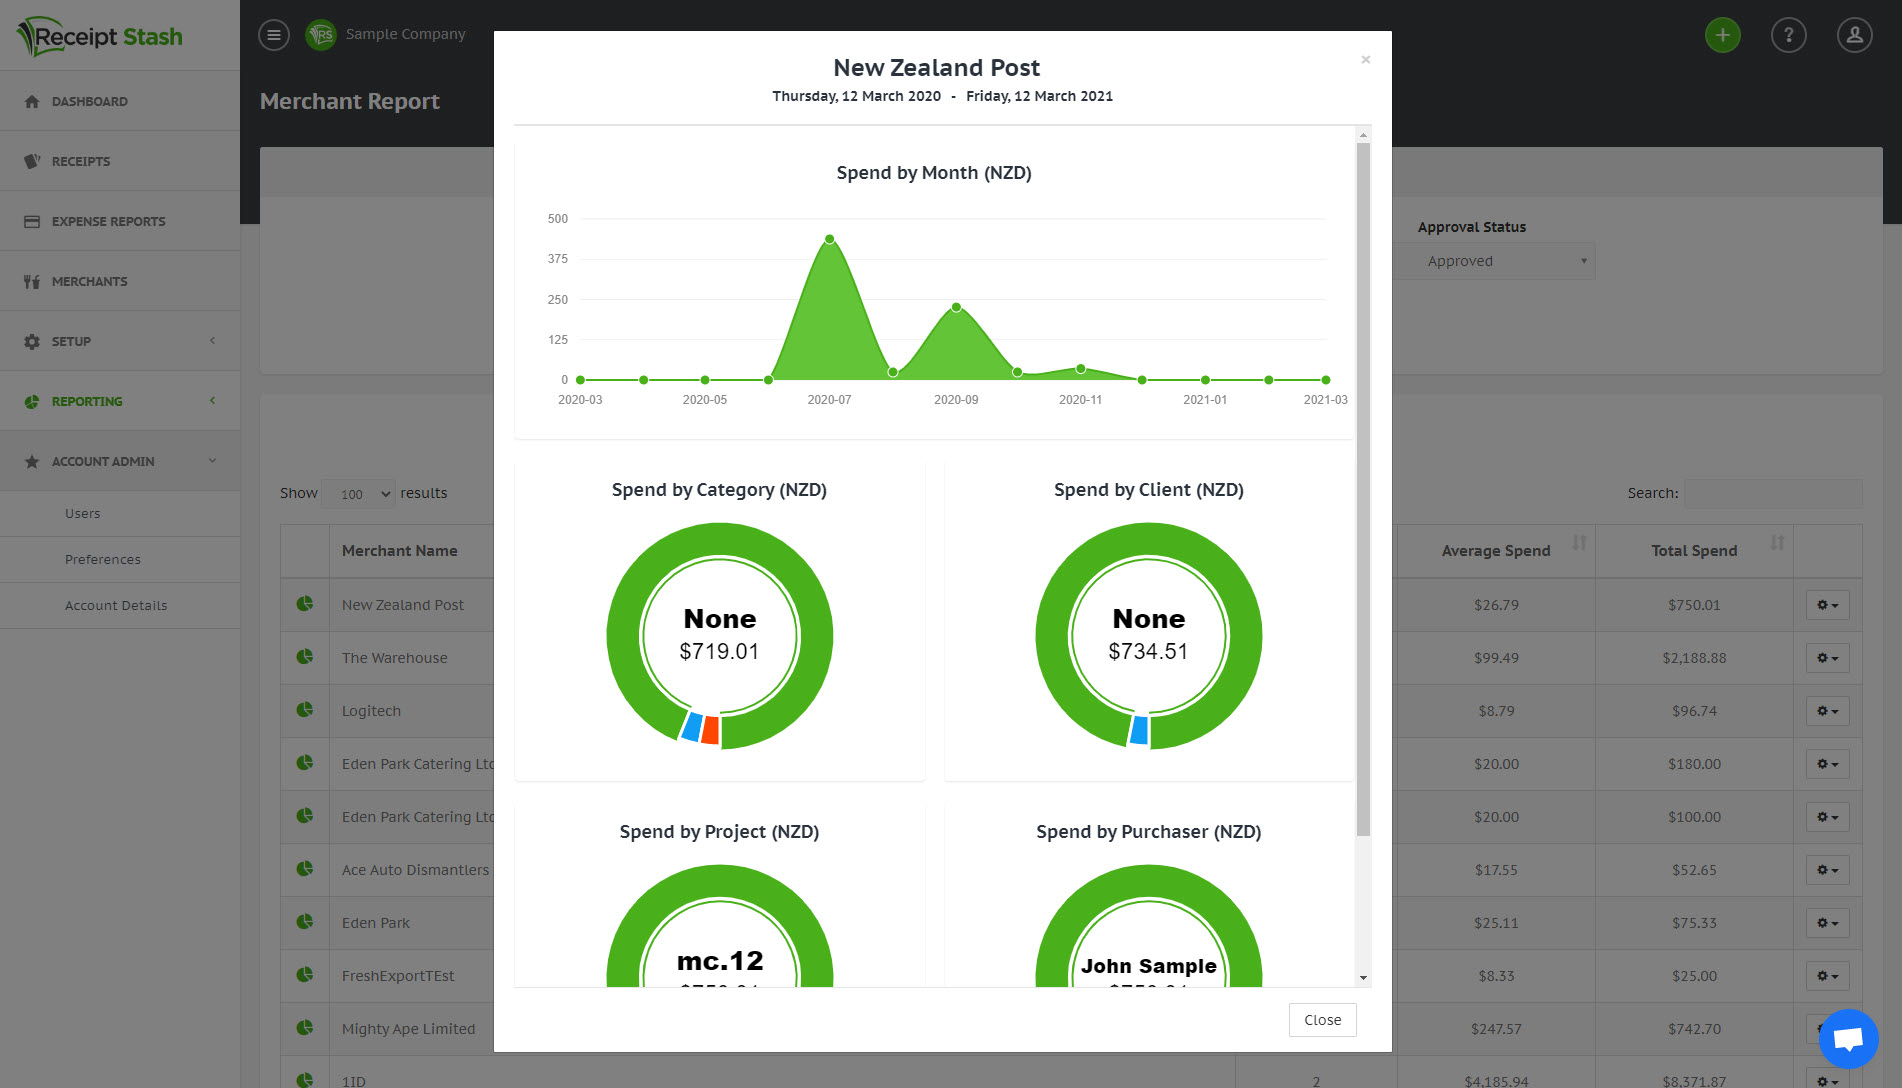
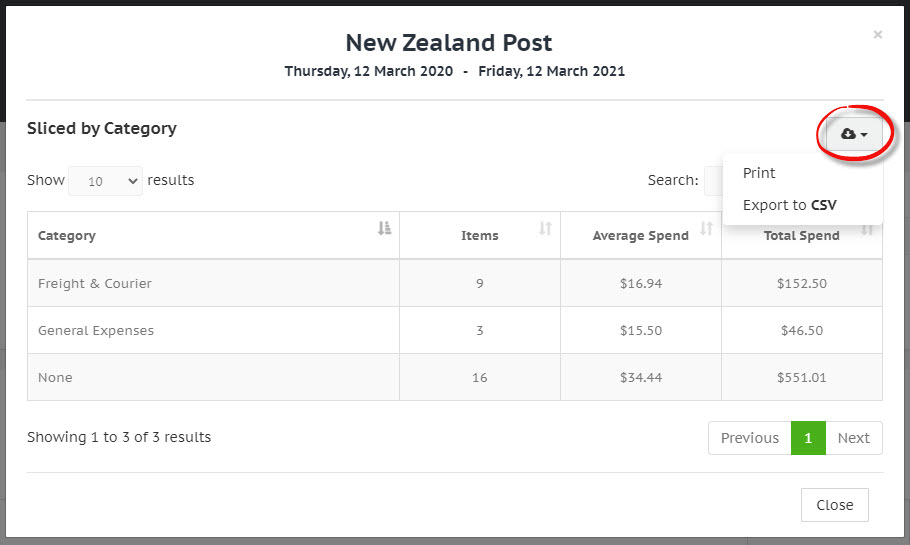
Data slice
Click on the data slice option to slice that report item by another attribute. This allows you to view a tabular breakdown of that report item based on your slice of choice.
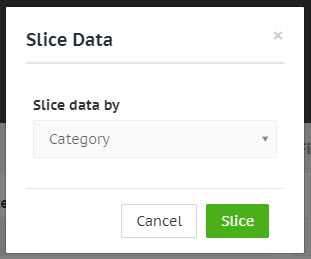
The results will be displayed in a data slice table, and can be sorted by clicking on a column header, and exported to a number of formats by clicking on the cog icon in the top right-hand corner above the table.